MolBox LLC provides computational and modeling support for investigators working on projects related to the structure-function relationship of proteins, as well as structure and ligand-based drug discovery and design.
Our state-of-the-art facility performs Sequence and Structure analysis, Molecular Modeling and Visualization.
We maintain a database of tens of millions of chemical compounds for in-silico screening against targets.
A selection of samples from our drug discovery work can be seen below:
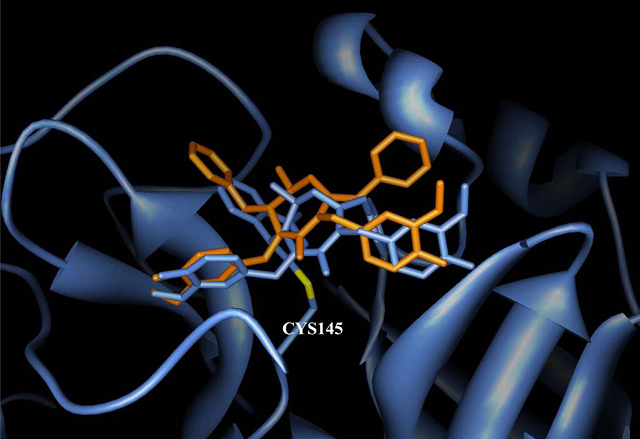
Comparison of binding modes of the cyclic urea-based HIV protease inhibitor (colored in orange) and its covalent analogue (colored in cornflower blue) to SARS 3CLpro active site. (Biochem Biophys Res Commun. 2004, 321:370.)
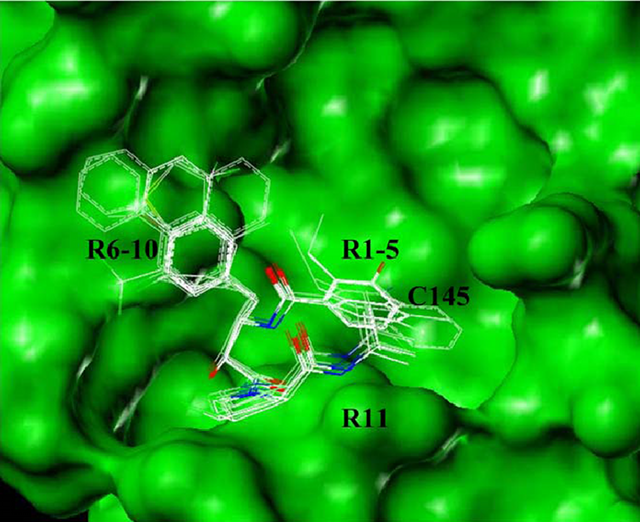
Illustration of the binding modes of 53 successful ligands selected from pharmacophore search in SARS 3CLpro-binding site. Functional group variations with respect to the pharmacophore are indicated by R1-11. (Biochem Biophys Res Commun. 2004, 321:370.)
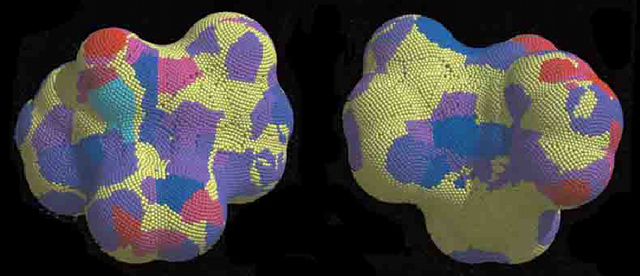
Color-coded molecular surface of nevirapine in the 1vrt complex. Cyan dots are the most favorable and red dots the least favorable contact regions. Yellow dots are non-occluded. The view shown on the right is the back side of the view shown on the left. (Curr Med Chem. 2002, 9:609.)
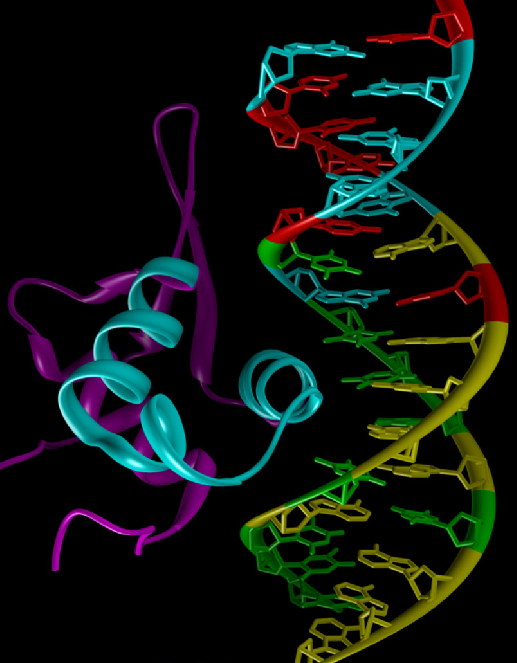
A ribbon model representation of the FOXM1 protein with a DNA binding site is shown. The cyan ribbon is the helix loop-helix domain of the DNA binding domain of FOXM1 (magenta and cyan.) The DNA is shown as a stick model. The color coding for the bases is: A, yellow; T, green; G, cyan; and C, red. (J Biol Chem. 2010, 285:40342.)